| Welcome to a...
Build Log |
|
Fig. 1 On this webpage about the dust collection devices I've made for my workshop, you can see that I have tried to keep my shop air clean, but I have always wondered just how effective these efforts have been. I can see the positive result of using these devices through the lack of dust particles that embed themselves various wood finishes as they dry. What about the air quality in general, though, especially the fine particles which are much less visible? Is there a way to make an inexpensive device to show how much dust is in the air? For some time now the Dylos monitors have been available, which are $200 to $425, a bit pricey for me. If this project is going to be of interest, it should be cheaper than those, which will dictate many decisions about this design. I found out about a sensor made to measure dust concentration in the Sharp GP2Y1010AU0F , but I wasn't thrilled with its characteristics. Then I found out about the Shinyei PPD42NS sensor, which looked like it might fit the bill. Also about this time, the small but fairly good definition screens (320x240) that are used on cell phones became available, and some even had a shield and library for use with the Arduino, so I got interested. The first screen I tried was the 2.4 inch TFT LCD display, chosen because it was only $25 for both the shield and display. There are larger screens (4, 5, and 7 inch with higher definition) but they are still over $50, more than I wanted to spend for just the display. The Dylos only has a 2 line dot matrix character display, so any graphics would be a big step up from that as well. Since we are just monitoring the air, I am hoping to avoid a complicated user interface here with buttons, etc. which not only makes it harder to use, but also raises the cost. Its just read the sensor, graph it on the screen, repeat. One additional thing about those displays is that they also include an SD card slot on the back. I can log the data, store it in a file on the SD card, and then upload it via the USB to a laptop on command so that the data can be massaged and graphed in a spreadsheet. I could have bluetoothed the uplink, but why add the expense when the USB is already available?
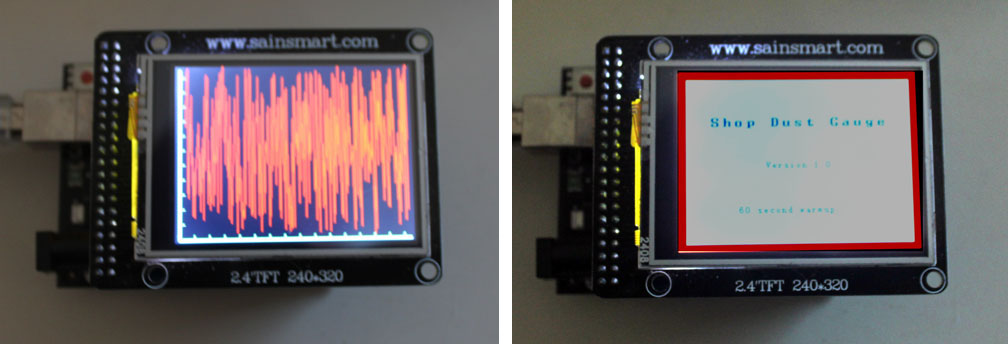
Fig. 2 Originally, I tried using the Uno Arduino and a display shield shown above since I already had one on hand, but this 2.4 inch LCD display used up all but one of the I/O pins of the Uno! I wrote the sketch shown running in Figure 2 while waiting for the sensor to arrive - it's just graphing some random data values - to see how it would look. Despite making some memory conservation efforts, I started getting low memory warnings just to graph the several hundred values on the screen shown above. Not a good thing. I decided to use the Arduino Mega 2560 R3. The cost difference is only a few bucks (at this writing, the Uno is around $7, and the Mega is $15 or so) but the Mega has 256K flash, 8K ram (Uno has only 32K flash, 2K ram) and the Mega has 54 digital and 16 analog I/O pins (where the Uno has 14 and 6). For those few bucks difference, the expansion room is well worth it even if the Mega it a bit more expensive and needs a slightly larger box to house it. Also, the 2.4 inch display just seems a little too cramped to me, so I looked at something a bit bigger. Screens are priced based on their size - the bigger they are, the more they cost. The difference between 2.4 and 3.2 is quite a bit in terms of readability when you get up close, so I think it is worth the money to me.
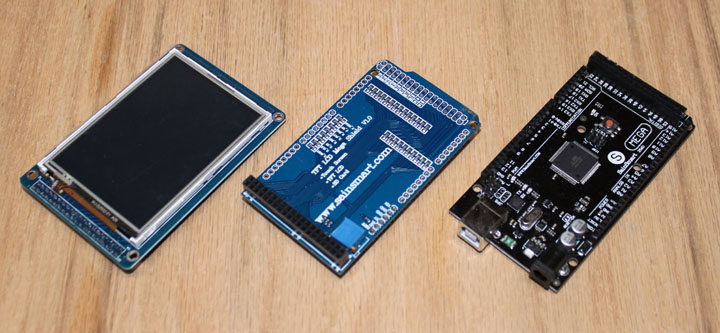
Fig. 3 Above are the main components selected for this project - a 3.2 inch TFT LCD screen, the shield that connects the display to the Mega, and the Mega 2560 R3 Arduino processor. From now on, the project photos will show the Mega covered by the display and its shield in between the two. At this writing, the display and its shield are about $25 and the Mega about $15, but shop around on the net - the link above was $40 for all three boards at this writing. You can also get these as a bundle, and they get cheaper every day. These three boards are a bit power hungry for a 9v battery supply, especially since you are probably going to want to run this for many hours at a time. I will be using a 12v wall wart, which I had on hand, and I'll probably just let it run continuously. You could wire up the screen to the Mega directly, saving the cost of the $7 shield, but I think the hassle saved in very intricate wiring is well worth the money I paid.
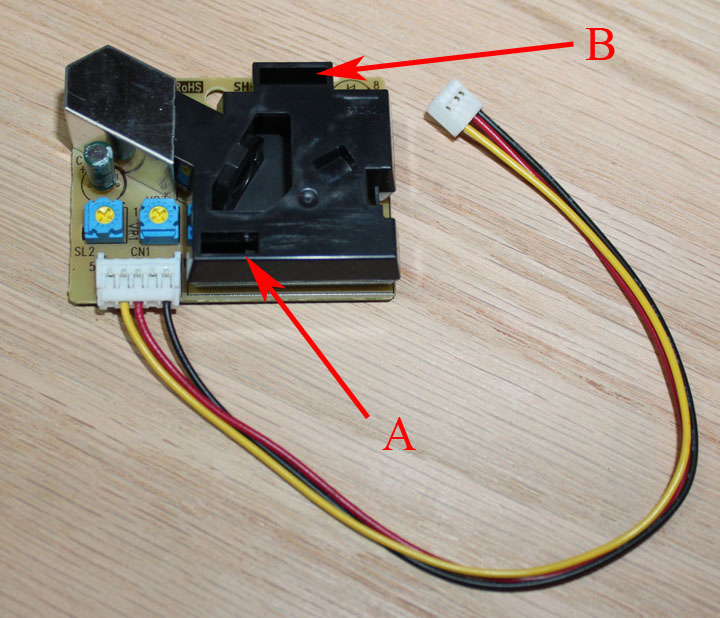
Fig. 4 Here is the part that makes this project possible, the Shinyei PPD42NS sensor. This $16 device works by shining a light through passing air, and measures the resulting dynamic light scattering effect. The fineness and density of the dust particles (or particulate matter, or PM) that are present in a moving stream of air, the more scattering that occurs. The black plastic part forms a housing with a resistor at its base, used as a heating element. The plastic chambers function as a chimney for the heated air to rise through, so no fan is needed to produce the right airflow. This means the sensor board must be mounted vertically, with the openings at the top and bottom unobstructed. The metal chamber on the upper left is the photo sensor that measures the scattering. The two on-board potentiometers have been calibrated at the factory and should not be adjusted. The opening marked A provides an inlet for the air, which flows up and out the opening marked B. These areas must not be obstructed. The open area between A and B is where the infrared light beam is measured, and so ambient light will probably affect its readings. It is left open on the sensor to allow the chamber to be vacuumed occasionally, but I think I will cover it with some black tape during normal use so that it won't matter if the shop lights are on or off. This method is applicable to very small particles. Indeed, our very sky is blue because this scattering effect of light (sometimes called Rayleigh scattering) which takes place off the molecules of air and is more pronounced at blue light frequencies. According to its spec sheet, this sensor should have no problem detecting the finer dust particles in the air, down to 1 micron. This method is different than the Dylos monitors, which actually count particles. Also, dust particles of varying composition can have different scattering effects, which would affect the concentration accuracy. In our application, we aren't really so concerned with absolute accuracy of particle sizes, as much as just having a relative idea about the concentration of dust in the air over time. However, because of the direct proportion between particle count and scattering, the result is a sensor that produces readings that are remarkably close to the Dylos. The sensor's interface is simple - power, ground, and a digital signal. The measurement we want is a particle concentration over time, and this is done by measuring the percentage of time the digital signal from the sensor is low over a 30 second period. In other words, it can produce a maximum of 120 readings per hour. One reasearcher, Chris Nafis, has done some nice work in this area, showing how closely the sensor's output tracks the Dylos, and produced a curve fitting algorithm to change the raw reading into a number calibrated in particles per .01 cubic feet of air. I will definitely incorporate his algorithm in this - thanks Chris! All in all, the Shinyei is fairly elegant device. There are a few caveats, though. The sensor needs about 60 seconds for the resistor to come up to a stable temperature in order to get the air to stream past the measurement chamber at a constant rate. The display graph has enough resolution to show about the last two hours of data at a glance, which I think should work out about right. At this time, the Mega, the display, the shield, and the sensor are about $56 total.
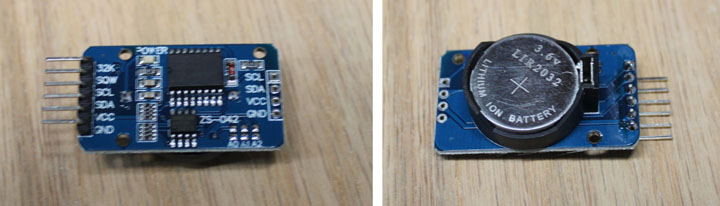
Fig. 5 Since we are going to be doing some data logging, knowing the time and date is important, so a real time clock is needed. Since we want the time preserved when the power is off, a battery backup is also needed. Luckily, there is such a beast for the Arduino, and it costs a whopping $3 - the DS3231 and it uses one of those CR2032 lithium batteries that should last several years on this extremely low power device. It uses the I2C interface on the Arduino, and there is a library to support it as well. One added bonus is a temperature compensation circuit on-board to aid the clock's accuracy. The temperature sensor it uses in that circuit can be read directly - another data item to include in the logging.
Fig. 6
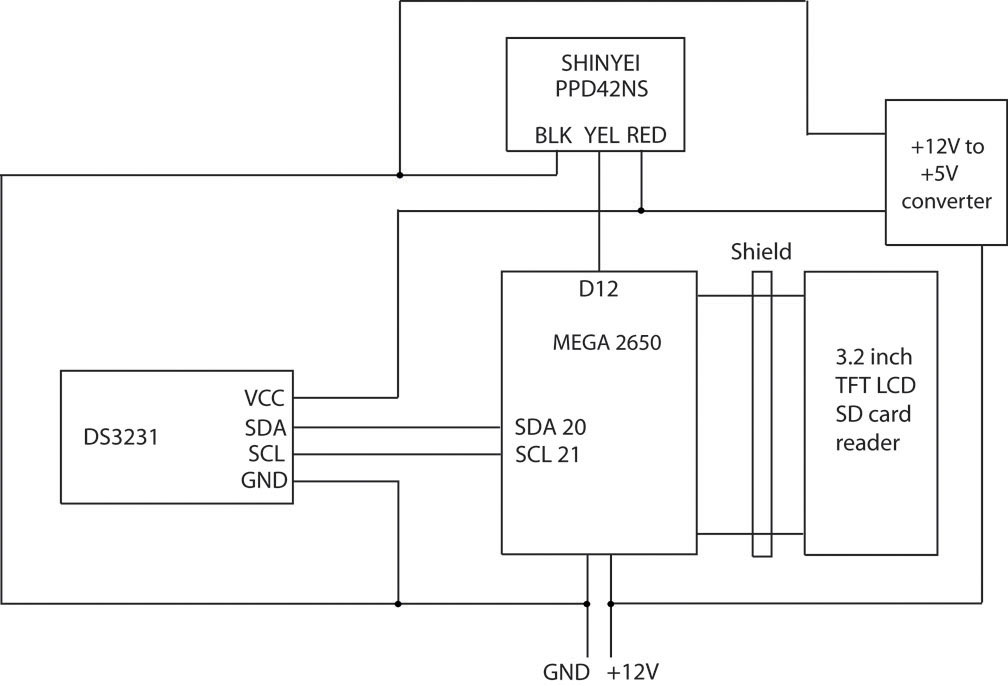
Fig. 7 Here is the wiring diagram for the whole device, which is very simple thanks to the shield that takes care of the display and SD card. The sensor has three wires - +5, ground, and signal which goes into the Mega pin D12. The real time clock DS3231 has +5 and ground, and the two wires that go to the SDA and SCL leads of the I2C inputs; its power consumption is practically negligible. The device can be powered from a regulated supply ranging from 7 to 12 volts. I am going to use a 12 volt wall wart I had, which has a 2.1mm plug on it, but you can find them in many places. For the really budget minded, you can usually pick them up for little money at many thrift shops. Just make sure they can supply around .6 to 1 amp or so. Everything else is placed inside the project box.
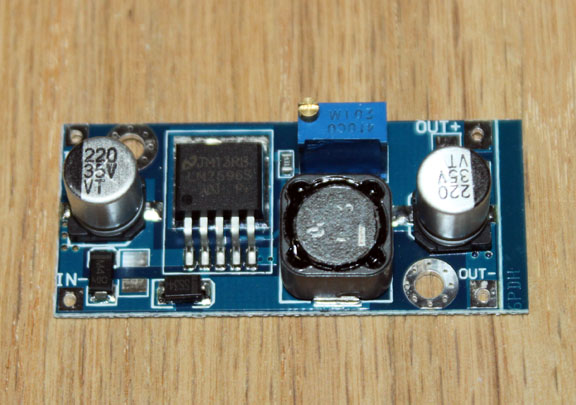
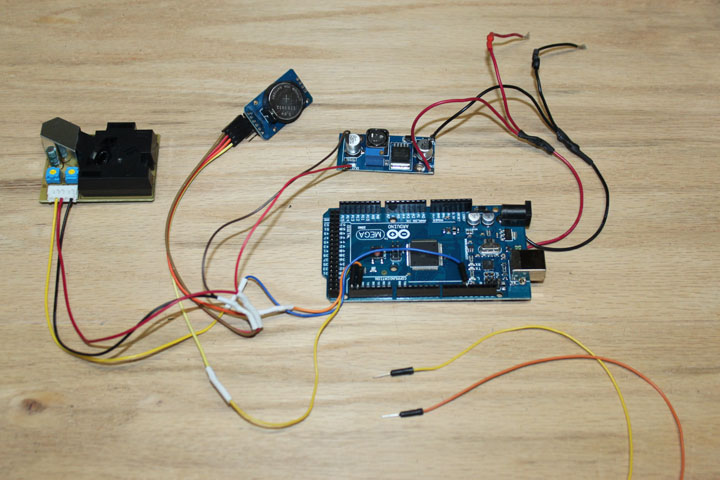
Fig. 8 Before hooking up everything, apply +12v across the input of the buck converter, and then turn the multi-turn pot until its output equals 5v. Above shows how the schematic works out in the physical world. Since the shield covers only some of the pins, we can use some female and male Dupont style jumpers to actually make most of the connections and simplify the wiring. Above, a set of four female end jumpers are plugged into the RTC, and the two signal wires SCL and SDA (yellow and orange in the photo) plug into to the Arduino headers with male jumper pins that are carefully bent at 90 degrees. An example pair of these jumpers are shown in the lower right. Likewise, a jumper in inserted into the pin D12 header (blue in the photo) and bent for the dust sensor input. These jumpers were then covered with a bit of tape to not only hold them in place, but insulate them from the shield that sits on top of them. Everything else is just routing power and ground according to the schematic. The two black and red wires at the top go to the 2.1mm socket on the box to provide the +12 voltage input to the unit. I chose to route the +12v input to its own socket on the bottom of the box, rather than use the one on the Mega that would stick out the side, but you can save the cost of that socket by just drilling a hole in the box next to the USB port to accommodate a 2.1mm jack into the Mega, and then solder wires on the bottom of the Mega board to go to the buck converter input. Above, the +12 and gnd wires from there are soldered directly to the back of the Ardunio power socket pins.
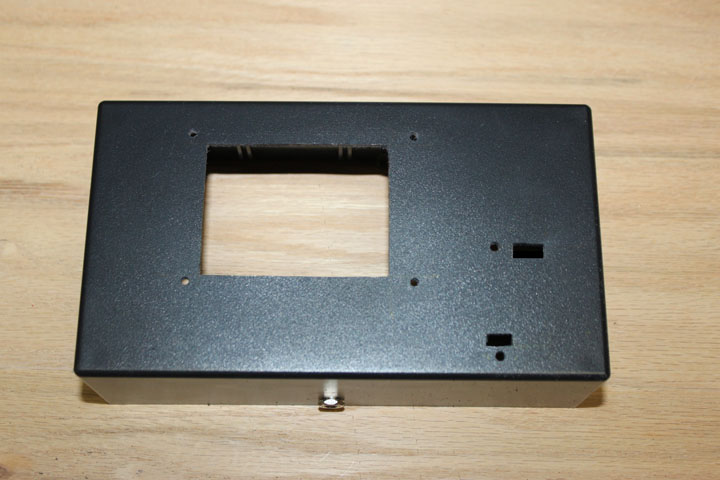
Fig. 9 Above are the holes I made in the project box to accommodate the display and sensor. The project box is a Hammond 4 1/4 x 7 5/8 inch with a flanged lid for mounting - the lid forms the base in this application. Also included is a hole near the bottom for the 12 volt 2.1mm power jack. A hole is also made on the left side of the box, positioned to allow a type B USB cable to connect to the Arduino. The Aruino/display assembly is mounted with some 1/4 nylon spacers such that the screen surface just touches the back of the box. The holes were cut by hand by just doing some careful layout, and drilling, using a Dremel tool, and some hand filing.
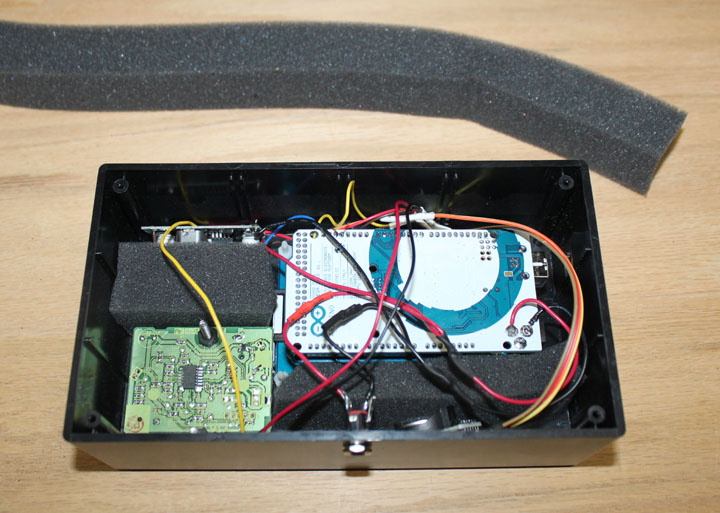
Fig. 10 Here are all the parts packaged in the box. I cut up some insulation foam (the kind used to seal around airconditioners) with scissors to keep the RTC and buck converters from moving around, and everything else is anchored. I used nylon screws to mount the display. Once the unit is wired together, we can tackle the software. First you need to have the Arudino IDE installed. I have tried this project's sketch and libraries with versions 1.05, 1.0.6, and 1.5.7 and 1.5.8 (beta), which is what I am currently running. If you don't have it already installed, you can get it from here. In order to connect the Gauge to the PC, you will need to have both the 12v supply plugged into the Gauge, as well as the USB cable, which should then be plugged into the PC. When that is done, you should find that a COM port has been created on the PC. Next, you are going to need some libraries to support all the devices we are using. Once those have been added, you can edit the sketch to change a few settings before loading the software. The libraries needed are: UTFT library - graphics library for the 3.2 display from Henning Karlsen. DS3231 library - support for the DS3231 real time clock, also from Henning Karlsen. SDfat library - support for the SD card file system, Adafruit wrapper. These three libraries need to be downloaded and installed on your machine. Two other required libraries, SPI and Wire, are already part of the Arduino distribution. With these libraries installed, the main program, DustGauge.ino can be edited to set some options. after launching the IDE with the ShopDustGauge.ino file, At lines 51-58 there are eight variables you can set: byte scr_graphtype = LINE_GRAPH; // this can either be LINE_GRAPH or BAR_GRAPHbyte scr_filtertype = RawData; // this can either be RawData or MovingAverage byte scr_lightScreen = 0; // 0= a light on dark color set or light on dark (0) byte tempType = 1; // 1 = Farenheit, 0 = Celsius byte WarmupPeriod = 0; // 0 = disable warmup, 1 = enable warmup byte Logging = true; // flag to indicate logging on/off byte Averaging = true; // flag for averaging on/off byte RemoveSingles = true; // flag to remove outliers on/off If you just want to see the Gauge work, leave these as-is (they are set like I normally run it) and compile and upload this sketch to the Mega. After the flash screen (if WarmupPeriod = 1, you will have to wait for 1 minute for a warm up) you should see a graph of zeros, like shown in Figure 1 but with the data flatlined.
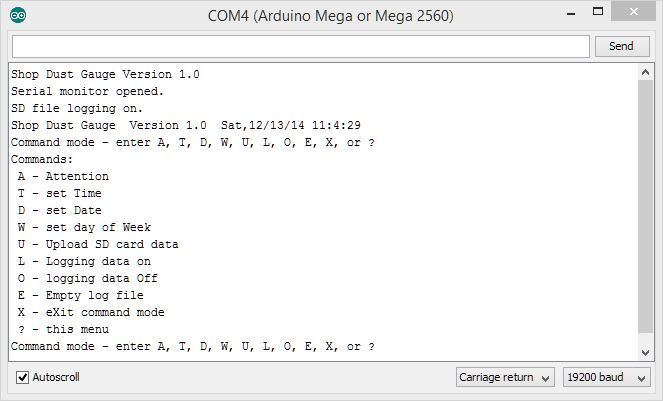
Fig. 12 Once the graph is displayed, notice although the clock is running, the time and date are not correct. This is due to the fact that the DS3231 real time clock has never been set. To do that, we need to turn on the serial monitor while in the Arduino IDE with the USB cable plugged into the Shop Dust Gauge. (In the IDE, select Tools...Serial Monitor) When selected, the com port will connect and the Arduino will reset, and begin running. In the Serial Monitor window, you should see a few lines of data from the Shop Dust Gauge showing its name, version, and status. If not, make sure you have the speed (lower right corner) set to 19200 baud and the field next to it set to "Carriage return" and try again. In the send line type the letter "a" followed by the Enter key (aka Return key or Carriage Return key). Do not type any further characters or click the "send" button.You may have to wait up to 30 seconds for a response because the DustGauge will be in the middle of taking a reading, and will repond just as soon as it completes the current reading. You should get a command prompt. If you then type a "?" key followed by an Enter, you should see the command help displayed, as in Figure 12. From the command menu, you can use the T, D, and W commands to set the time, date, and day of week, as well use other commands to turn data logging on or off, upload the logged data, show the current size of the log file, empty the log file, and toggle some graph types. These functions are only available while the Shop Dust Gauge is connected to your computer via the USB port. While in this command mode the gauge is not taking readings, but will continue to take readings as soon as you enter the "X" command for exit. The command letters are case insensitve.
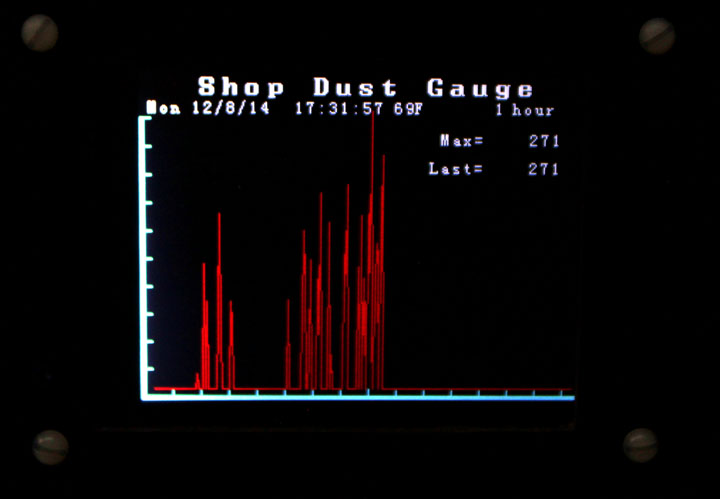
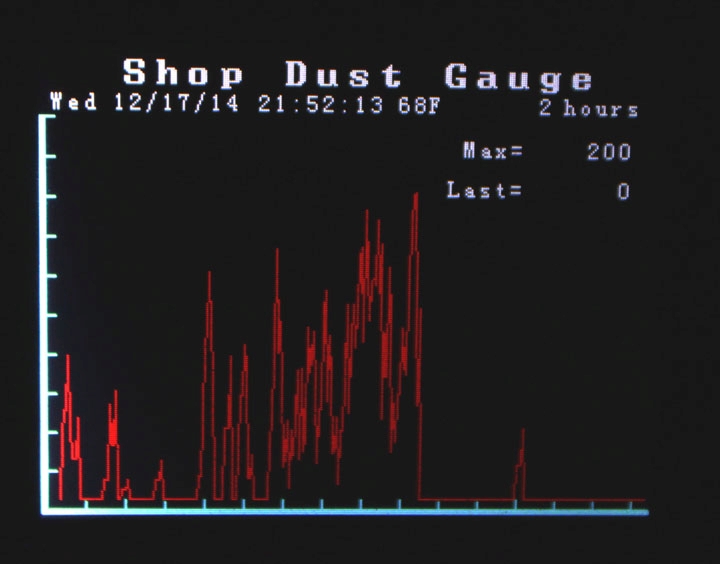
Fig. 13 So, how well does it work? Above, reading the graph from right to left, (oldest to most current) the first small spike is when I went into the shop to pick up a tool. Just walking around in there stirs up the dust a bit. The steep spike is when I began using a random orbital sander in medium grit, stopped to swap a finer grit sandpaper (it was just a hook and loop changeout, but I had to search for it) and then continued sanding for quite a while. I then used a shop vac to clean up a bit, which also caused some steep spikes. It then died out a bit until I came back into the shop a couple of times and was moving near the gauge to take the photo in Figure 13. All in all, just what I was looking for! This project was a two-part article starting in the Spring 2015 issue of Digital Machinst Magazine. Comments may be directed to gary at liming daught org. Thanks for viewing this build log! |
|